Overview
Developed hands-on data-analysis and AI-augmented technical workflows as part of continuous professional development and modern IT practice.
Applied Uses
- Technical research and solution exploration.
- Troubleshooting and log/error analysis.
- Scripting and workflow prototyping.
- Technical documentation and process development.
- Data analysis and structured problem solving.
- Prompt engineering for repeatable professional workflows.
Professional Control
AI-generated suggestions are independently reviewed, tested, and validated before implementation, with attention to security, privacy, confidentiality, and operational requirements.
Detailed Project Scope
Build a traceable analytics case study that helps readers follow a dataset from initial inspection through reliable conclusions. The current portfolio example uses a healthcare-related dataset to illustrate data quality, transformations, statistical interpretation and reproducible reporting, while AI assistance is treated as a reviewed engineering aid rather than a source of unverified answers.
Technical approach and validation
The work will use a data dictionary, transformation log, staged source files and reproducible notebooks. Each finding must be traceable to an input, calculation, analytical decision and validation check. Before publishing charts or claims, the methodology will distinguish descriptive observations from causal conclusions and explain missing data, leakage risks and limitations.
Project Roadmap
The roadmap below tracks the case study from research framing through repeatable reporting. DA-01 through DA-03 are now In Progress based on verified Excel / Power Query evidence. Later Python, SQL and reporting phases remain planned until their outputs have been run and checked.
DA-01 — Research question and dataset inventory Completed · Validated
- State a focused question and define target measures
- Review field names, types, units and documentation
- Record provenance, licensing and confidentiality constraints
Verified deliverable: Dataset intake, provenance, 50-field structure, encounter-level grain, and baseline record counts documented.
DA-02 — Excel data profiling Completed · Validated
- Count records and inspect data types, nulls and duplicates
- Identify categorical ranges, outliers and impossible values
- Create a baseline profiling log with reproducible screenshots
Verified deliverable: Full-dataset profiling and documented data-quality findings.
DA-03 — Cleaning and transformation Completed · Validated
- Define deterministic rules for missing or inconsistent values
- Preserve an untouched raw dataset and version transformations
- Reconcile row counts and key measures after each cleaning operation
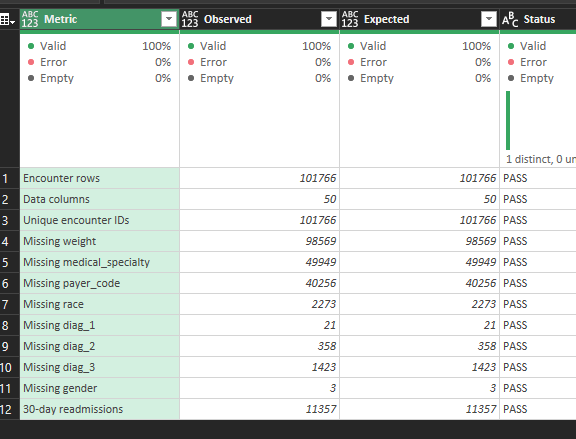
Verified deliverable: Audited UTF-8 cleaned extract, eight documented transformations, 12/12 Excel reconciliation checks, and 33/33 independent export QA checks.
DA-04 — Python exploratory analysis Planned
- Build a Jupyter/Pandas ingestion and validation notebook
- Compute descriptive measures and segment the population appropriately
- Create charts with clear denominators, labels and uncertainty notes
Expected deliverable: Reviewed notebook and explanatory plots.
DA-05 — SQL analysis Planned
- Load the validated subset into a documented SQL schema
- Write aggregation and cohort queries for selected questions
- Cross-check SQL outputs against independent calculations
Expected deliverable: SQL scripts and reconciliation table.
DA-06 — Reporting and interpretation Planned
- Select a small set of decision-relevant visualizations
- Draft a Power BI or equivalent dashboard after validated measures exist
- Document interpretations, constraints and alternative explanations
Expected deliverable: Dashboard draft and findings narrative.
DA-07 — AI-assisted workflow validation Planned
- Record where AI was used for research or code suggestions
- Review output for correctness, security and reproducibility
- Compare human-verified results with proposed automation
Expected deliverable: AI-use statement and quality-control checklist.
DA-08 — Final case study and repeatability Planned
- Publish sanitized evidence and downloadable non-sensitive methodology
- Link each chart to its source method and validation notes
- Document lessons learned and potential next analytical questions
Expected deliverable: Evidence-based published analytics case study.
Excel Data Quality & Cleaning — Completed
QA checks passed · Excel / Power Query data preparation completed
A traceable preparation workflow for the historical Diabetes 130-US Hospitals dataset is now complete. Using Excel Power Query, the project profiled 101,766 hospital encounters across 50 source fields, preserved the untouched source, and applied eight documented transformations: seven source ? missing-value markers plus one Unknown/Invalid gender category. Encounters were not deleted and unsupported values were not imputed.
Dataset integrity and reconciliation
The validated export contains 101,766 unique encounter IDs and 71,518 unique patient IDs, with zero duplicate encounter IDs. A row-by-row, cell-by-cell comparison against the original source found zero unexpected differences after the eight intended replacements. A separate Python script was used only as an independent export-integrity check; Python exploratory analysis remains a later roadmap phase.
Repeat encounters: 16,773 patients have more than one encounter. That is not equivalent to a 30-day readmission and is retained as legitimate encounter-level history.
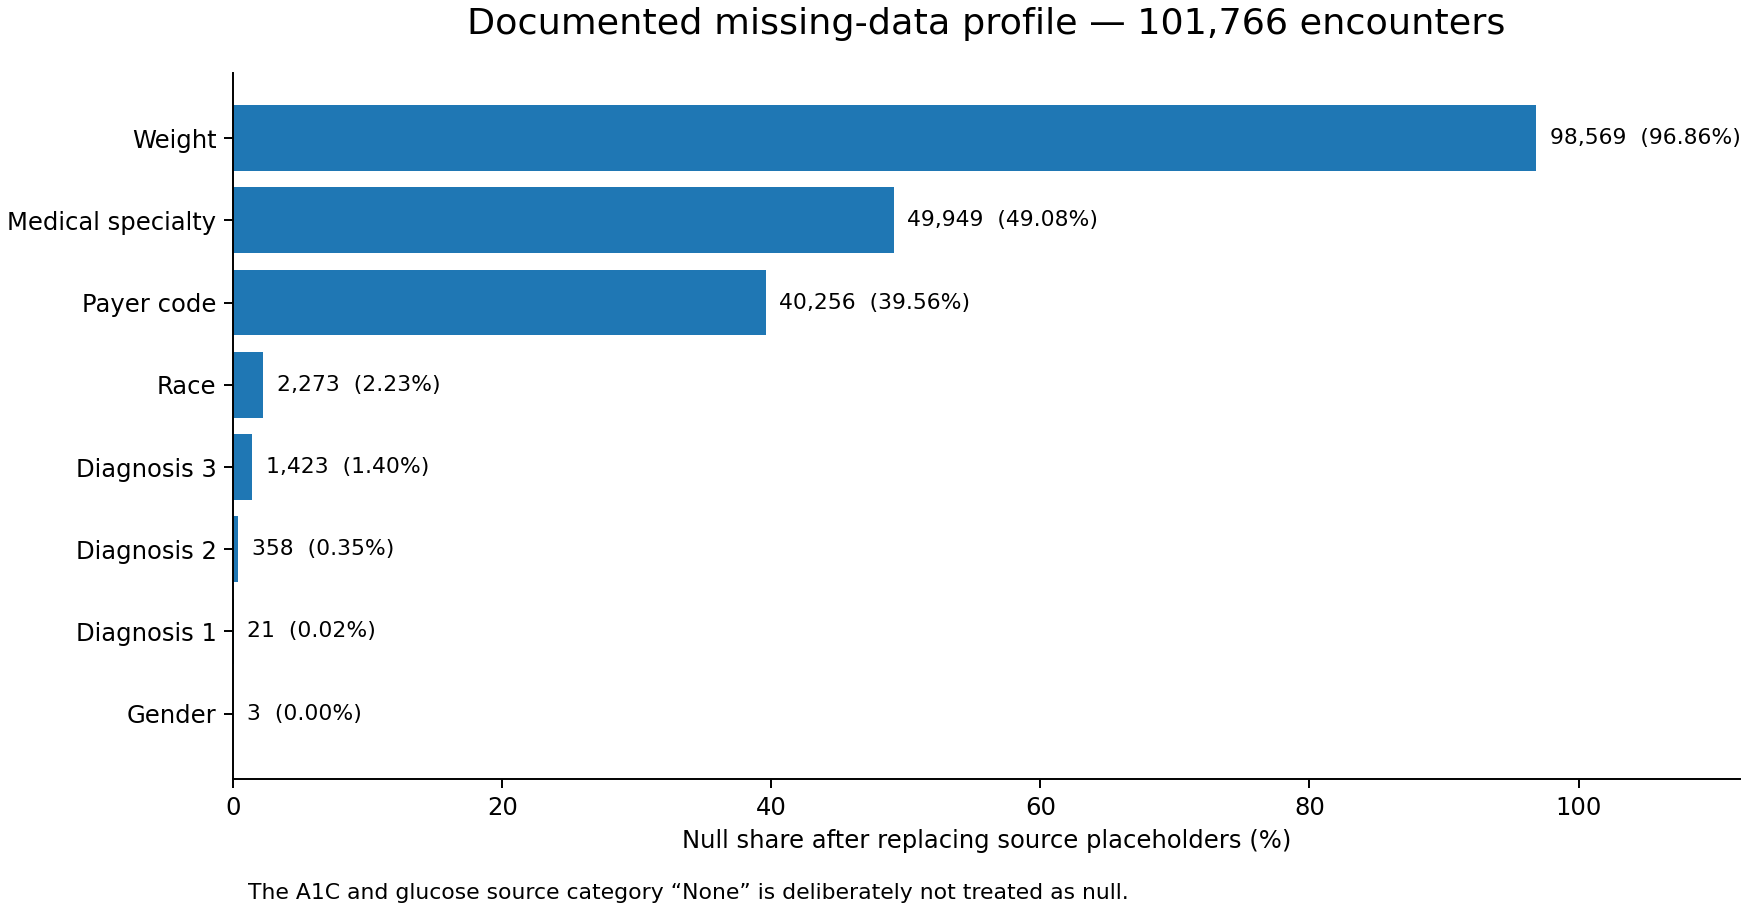
None in A1C and glucose fields is deliberately not treated as null.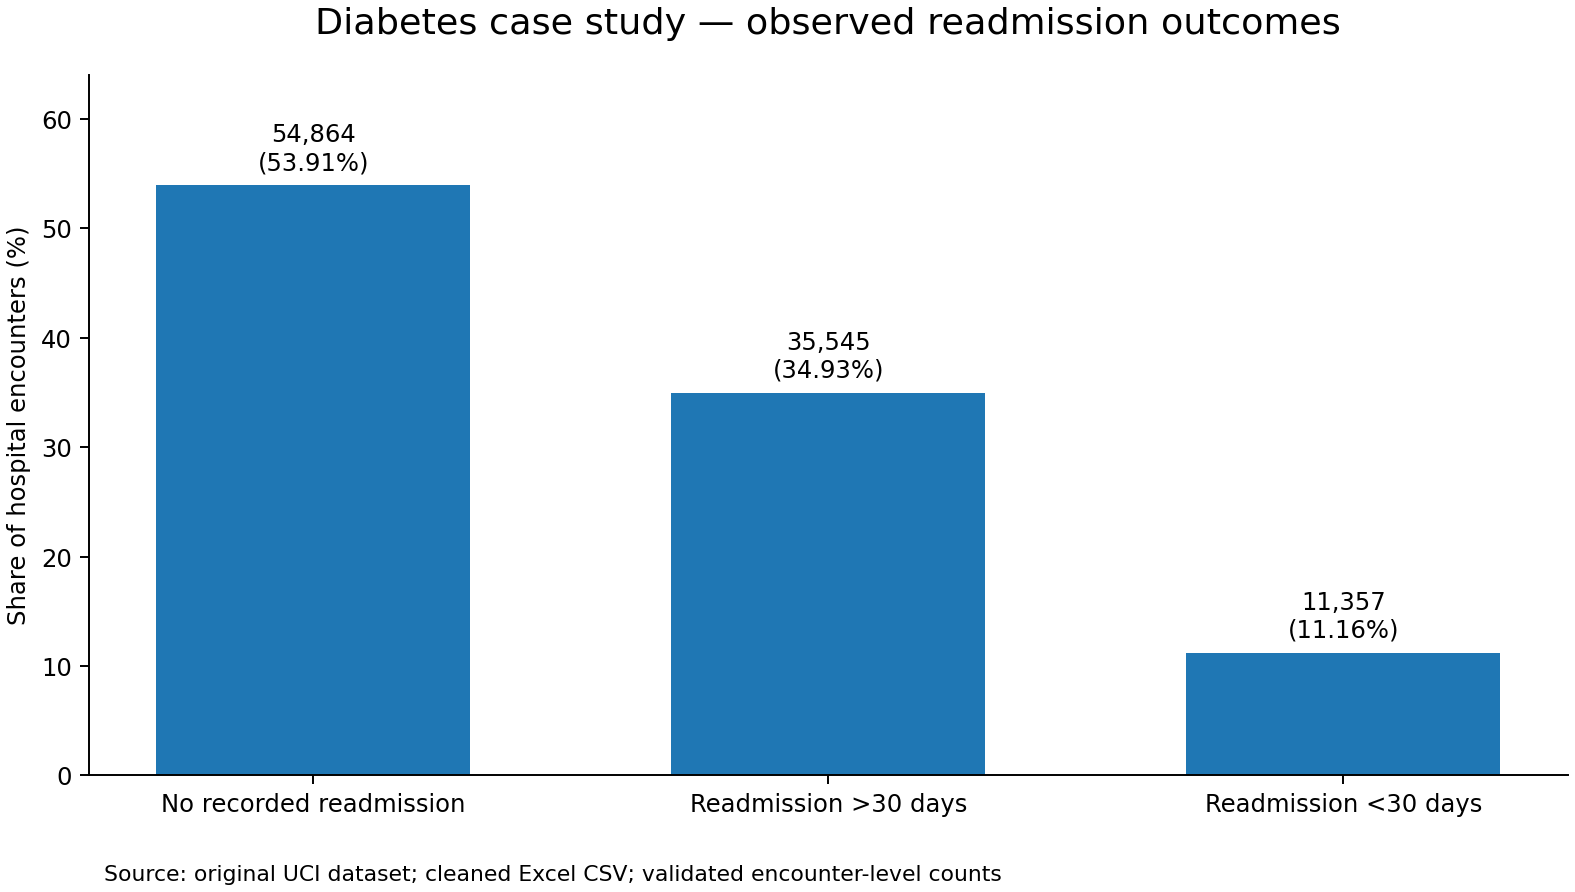
Excel quality-control evidence
Baseline outcomes and limitations
Readmission labels are preserved as recorded: 54,864 NO, 35,545 >30, and 11,357 <30. The <30 category represents 11.16% of encounters. This is a descriptive baseline only.
Source-recorded weight is absent for 98,569 encounters (96.86%), medical_specialty for 49,949 (49.08%), and payer_code for 40,256 (39.56%). The source-coded None labels were preserved as categories for A1C (84,748; 83.28%) and glucose testing (96,420; 94.75%), rather than converted into clinical measurements.
Next analytical phase
DA-04 begins with Jupyter/Pandas exploratory analysis, followed by SQL validation, Power BI reporting, a light Tableau comparison, documented AI-review practices, and final integrated interpretation. No EDA finding, prediction, causal effect, SQL dashboard result, model accuracy, or clinical-efficacy claim is presented as completed.
Data source: UCI Machine Learning Repository — Diabetes 130-US Hospitals for Years 1999–2008. Historical public research data.
Project Updates
Excel / Power Query preparation phase completed
The initial Excel data-quality and cleaning phase is complete and independently reconciled. The workflow preserved 101,766 encounters and all 50 source fields while applying exactly eight intended replacements: seven literal missing-value markers and one invalid gender category.
Validation: 12/12 final Excel reconciliation checks passed, 33/33 independent cleaned-export QA checks passed, duplicate encounter IDs remained at zero, and a cell-level comparison found zero unexpected differences from the original source beyond the intended transformations.
Baseline: 11,357 encounters carry the historical <30 readmission label (11.16%), 35,545 carry >30, and 54,864 carry NO. These are descriptive encounter-level labels, not predictive or causal findings.
Next planned update: Begin DA-04 with reproducible Jupyter/Pandas exploratory analysis using the validated cleaned export. SQL, dashboard reporting, and integrated interpretation remain planned.
Scope note: This is an independent learning and portfolio analysis of historical public data. It is not presented as a clinical prediction tool or current clinical guidance.